Library User Group Meeting
December 15, 2015
Agenda - Attendance
The purpose of the library user group is to form collaborative relationships and share expertise relative to library and information services among Trumbull and Ashtabula County library/media professionals.
Overview:
The main topic of this meeting will be about creating your annual library report(s). Per our last meeting, we would like everyone to bring/share what they have done in the past regarding their annual library report to begin our discussion (sample reports, tools, statistics gathered, etc).
Jennifer Schwelik, from INFOhio, will be attending our meeting, too! She will be talking briefly about ways that INFOhio can provide statistics and other useful information as it pertains to annual library reports.
Here are some ideas from our November meeting of useful things to include in an Annual Report:
- Try using infographics! (Great presentation by Caroline Hines and Amanda Hoover from Niles City Schools) Don’t forget to register for INFOhio’s webinar on 12/10/2015 on Infographics!
- Library system-created statistics (ex. circulation statistics that correlate with # hours spent in library or compared to ADM)
- INFOhio electronic resource statistics – if available
- Any statistic that shows your contact with a student or teacher
- Any lessons that you’ve collaborated with a teacher
- Daily log – of what you are doing
- Behind the scenes issues (book binding, other tasks not necessarily library related)
- What do you need in your library – ways to evoke/survey needs staff/students
- Comments from students/teachers regarding “Things I like most about the library…”
Shared by Laura Henning, TCTC:
Here's the link to the student survey I conducted at the end of last year that the users' group was interested in:
https://docs.google.com/a/tctchome.com/forms/d/1JgRuvD624y6eRfNp_cvZ4h5F-7X1MSlDbzSnwzaORiQ/copy
This link will force the viewers to make a copy of the survey I created so that they can edit it at their own will without changing my original form.
Shared by Andria Morningstar-Gray, Lakeview High School:
LHS Library Media Center Teacher Librarian Collaboration Record (used to track classes taught, units co-planned, pathfinders created, booktalks prepared, professional development sessions led, etc.): http://goo.gl/forms/rC7XTb6KP5
LHS Library Media Center Student Usage by Facility/Lab/Space (tracks how many total students visit with whole classes): http://goo.gl/forms/GbBXgzCkgr
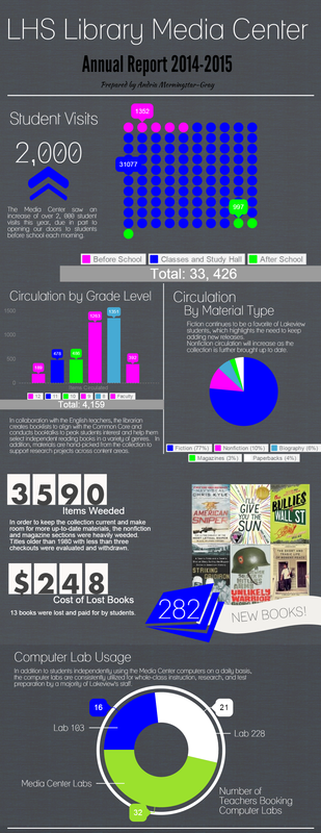
Andria used Piktochart last year to create our annual report; it's free and easy to use to create bold infographics. Below is a portion of the chart that she shared with administrators:
LHS Library Media Center Teacher Librarian Collaboration Record (used to track classes taught, units co-planned, pathfinders created, booktalks prepared, professional development sessions led, etc.): http://goo.gl/forms/rC7XTb6KP5
LHS Library Media Center Student Usage by Facility/Lab/Space (tracks how many total students visit with whole classes): http://goo.gl/forms/GbBXgzCkgr
Andria used Piktochart last year to create our annual report; it's free and easy to use to create bold infographics. Below is a portion of the chart that she shared with administrators:
Examples of Infographic Annual Reports:
- https://magic.piktochart.com/output/6433165-2015-annual-report
- http://issuu.com/daalibrary/docs/2013-14_annual_report
- https://www.smore.com/f6xjj-the-g-e-m-m
- Here is a whole Pinterest Board (that Joyce Valenza, highly acclaimed librarian, is following) all about library annual reports: https://www.pinterest.com/joycevalenza/ru-575-school-library-reports-safari/
 RSS Feed
